Table of Contents
Printed Circuit Boards (PCB)
A Printed Circuit Board is an electronic component at the center of most electronic devices. It allows the power supply and interconnections of different electronic components.
System definition - Goal and scope
Definition
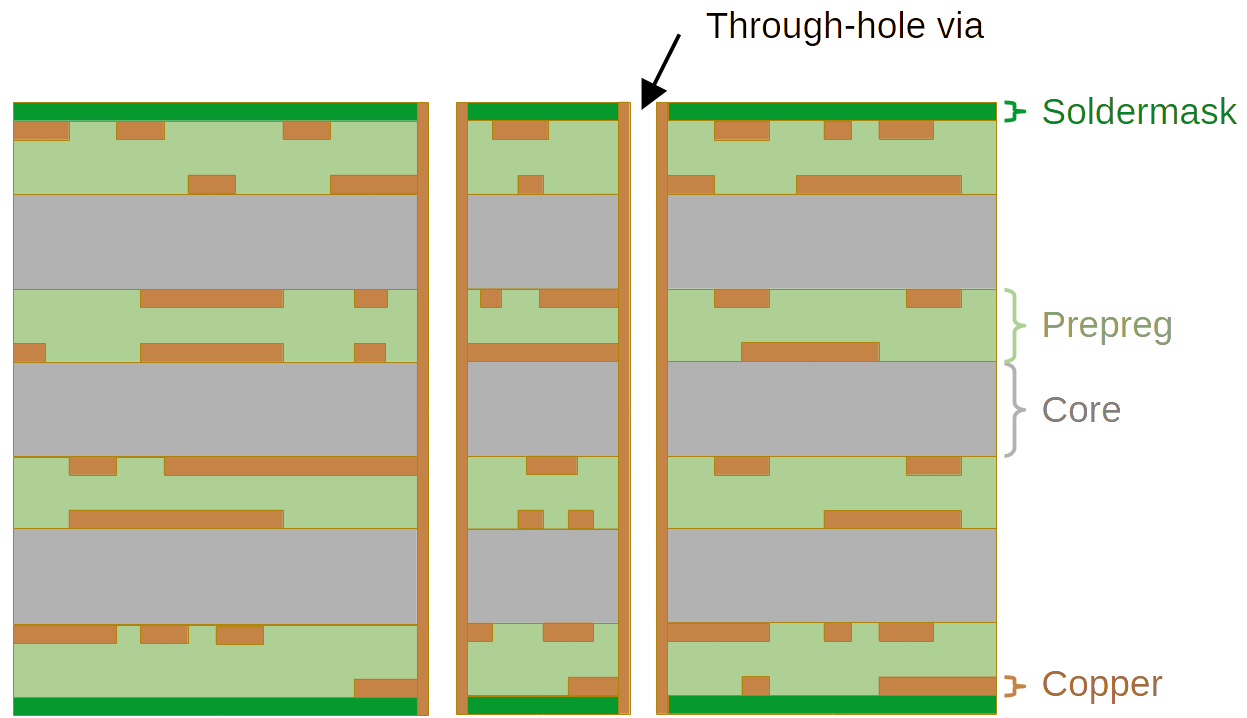
A Printed Circuit Board (PCB) or Printed Wiring Boards (PWB) consists of a superposition of alternating conductive and insulating layers. The ensemble forms a set of conductive lines, used for routing power and signal in electronic components. The insulating layer can either be core layers, that constitute the inner structure of a layer, or prepreg, i.e., pre-impregnated, which constitute the interconnections between layers. The succession of layer are visible on Figure 1. A PCB with electronics components mounted on it can be called a Printed Circuit Board Assembly (PCBA), whereas a PCB without any components is known as a bare PCB.
Function
PCBs are used to interconnect components soldered on top of the electronic circuit. It distributes both signal and power to assembled components like CPUs, SSDs, RAM slots… Printed Circuit Board are contained in the vast majority of today electronic devices, from PCs to wearables passing by cars, to name a few.
Types of PCBs
We can categorize bare PCBs according to 3 criteria 1) : the number of layers it is made of, its structure which is either rigid, flexible or a mix of both, and its specificity according to the component it will be integrated it. Each of those categories are detailed in the following parts, as well as the high-level impact each category has on manufacturing process and material composition.
Number of Layers
The number of layers refers to the number of repetition of conductive traces layers. The layers are interconnected one to another via copper traces. The more layer with similar density will enable more possibility of interconnections between components. It induces 3 categories of PCBs, each having its own impact on the manufacturing process 2) and field of application:
- Single-sided PCB: only one side of the board contains a conductive trace. Thus, the manufacturing process is the shortest as it involves printing and plating of a single trace and requires no alignment with other trace layer. As there is only one trace, it cannot interconnect many component and is thus used for very simple application like toys or basic calculators.
- Double-sided PCB: the two sides of the board contain a conductive trace. Thus, alignment of drills needs to be performed as well as trhough-hole plating to ensure inteconnections between the two sides of the PCB. This type of PCB is more common for power supplies, HVAC (heat, ventilation and air conditioning) controllers or more complex IoT devices.
- Multilayer PCB: The board contains several layers (above 2) of conductive traces. It implies to superimpose serveral layers of insulating layers. The manufacturing is more complex. It requires the repetition of pattern printing and plating on each inner layer, which are then laminated together, before following the same manufacturing steps as in lower-layer count PCBs. The number of layer requires a high accuracy alignement of layer before driling to ensure inter-layer interconnections. This type of PCBs can account for diverse level of complexity, and are the one used in most electronic devices, like computers, medical equipment, TVs, etc. Figure 1 represents the structure of a standard multilayer PCB.
The more layer, the more substrate, insulating material and copper traces.
PCB structure
The structure of the PCBs 3) aims at distinguishing the requirements in terms of shape of the of PCBs depending on which product it will be integrated in.
- Rigid: A rigid structure is the most classic shape of a PCB. It is composed of rigid and robust material, usualy FR-4 (flame retardant 4) material. It is compatible with both assembly technology. It is the most common structure and present in components like computers, medical equipements.
- Flex: It is composed of flexible plastic film like polyimide or PET. It adapts to many equipment shapes, it is light and resistant to vibration. It is particularly present in wearables.
- Rigid-flex: The structure is a mix between rigid PCBs boards and flexible interconnection between them. It combines the advantages of rigid PCBs while adapting to compact components. It requires complex lamination step to combine both PCB structures.
PCB specialisation
The specialisation of the PCBs 4) refers to categories of PCBs with a specific need, thus requiring specific properties.
- High temperature: It is the type of PCB required when the component is exposed to very high temperatures or is assembled with high temperature technologies. The substrate is made of specific high glass transition temperature that remain stable under high temperature.
- Heavy copper: this PCBs contains a high thickness of copper. It is used for application where current is high in order to avoid voltage drops, overheating and limit current loss. It is selected for power converters, power distribution or battery management systems.
- High frequency: it is used for application where a high frequency of interconnection is required and thus must ensure signal integrity and minimize signal loss and distortion. The substrates are made of hydrocarbon ceramics or modified epoxies in such cases. It is used for high-frequency systems like 5G/6G antennas, radar systems or communication system of satellites.
- Metal core: This kind of PCB contains a metal core, in addition to copper traces. The metal core, often made of aluminium, helps to dissipate heat for component with high power like LEDs or power transistors.
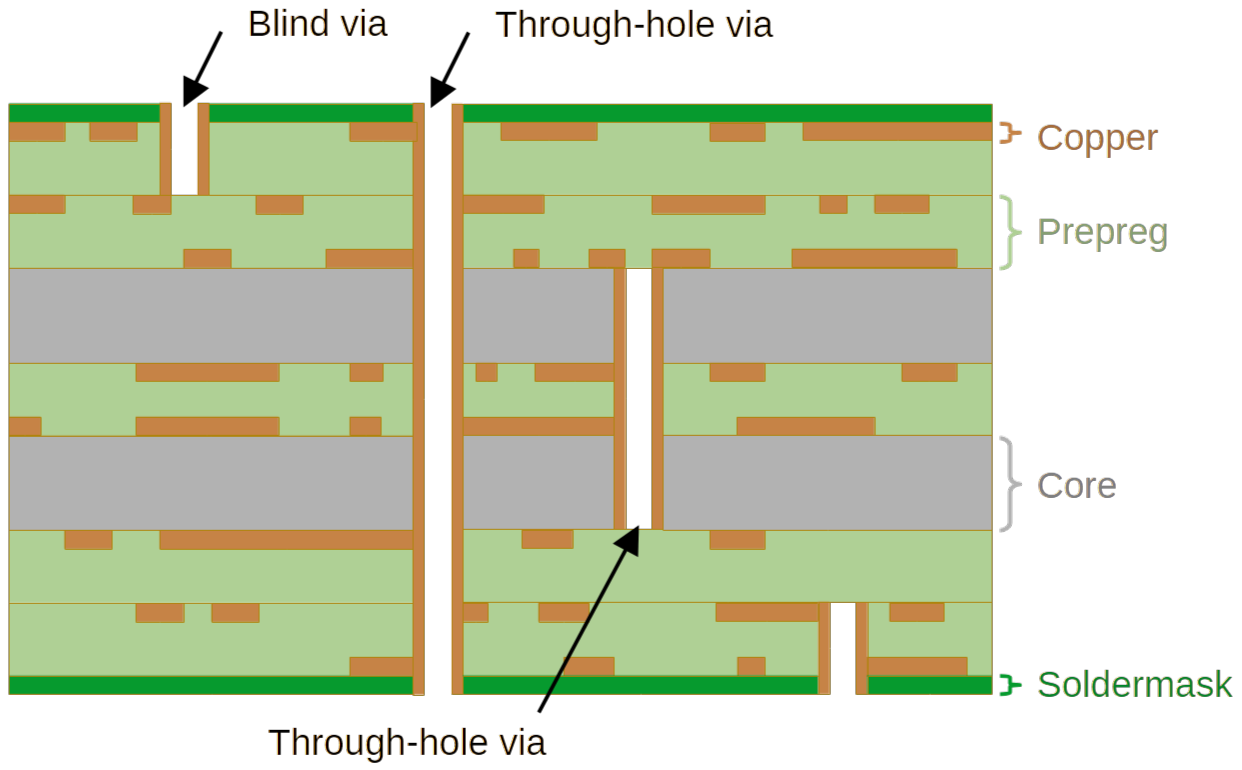
- High Density Interconnect (HDI): The high-density interconnect PCBs aim at concentrate a high density of interconnections between several components. It is possible thanks to burried vias and micro-vias, in addition to through-hole vias, as displayed in Figure 2. The drills are performed using laser drillers. It is mainly used for compact devices, smarthones and high-end equipment (servers…).
- Substrate-like PCB 5): This kind of PCBs embeds even more dense interconnections with very thin traces than HDI PCBs. Its manufacturing process is highly inspired from IC industry. It requires semi-additive process for plating steps and UV laser direct imaging technology to maintain very thin interconnections. This is particularly useful for high-perfomance components with a high compactivity like high-end smartphones.
- Standard PCB: The standard PCB structure is usually made of FR4 substrate. It is employed when none of the previously mentioned specialization are required.
Assembly technologies
Once the bare PCB is manufactured, elements to be interconnected need to be assembled on top of it. Among the elements that populates PCBs, we can find CPU sockets, RAM slots, but also capacitors, resitances… The PCB can be populated according to two technologies 6):
- Through-Hole Technology (THT). It consists in having leads passing through previously drilled holes, that are soldered on pads present on the opposite side of the PCB. This is an old technology, but still used for some power electronics.
- Surface-Mount Technology (SMT). The components are directly soldered on pads, without requiring through holes. It is the technology used for most digital equipment.
The assembly technology do not influence drastically the manufacturing process of bare PCB. It can sometimes influence the choice of substrate when it implies high temperatures.
Sub-components
The system is composed of one main part, the board itself, which is composed of a succession of layers of substrate, insulating material and copper traces. When the PCB has a rigid-flex structure, we can consider that it is composed of a set of rigid PCB board, connected via a set of flexible PCB board.
Market overview
Main manufacturers characterization
The main manufacturers are characterized by their market share.
Market description and main manufacturers
The Pacific-Asia region concentrates 57% of of the worldwide PCB market. The predominant company on the market is Zhen Ding Technology Holding Ltd., located in Taiwan and owning 12 to 17% of the market share. It is followed by Nippon Mektron, Ltd, located in Japan, holding 10-15% of the market share. TTM Technologies is an american manufacturer, having 9-13% of market share. The top 4 is closed by the tawainese company Unimicron Technology Corp., with 8-12% of the market share. The Europe main manufacturer is AT&S, based in Austria 7).
The Asia-Pacific market is in general more focused on the mass production of PCB at affordable prices, whilst American and European market are more oriented towards cutting-edge PCB manufacturing technologies. 8). The PCB market represents 71.49 billion USD in 2024 9). The multilayer PCB market has been estimated to represent about 23,140 billion USD in 2024 and tend to grow slowly to meet continuous demand for miniaturisation. The production of multilayer PCBs is mostly performed in Asia-Pacific, particularly in China owning about 60% of the global market share 10). The double-sided PCBs market follows that of multilayer PCBs, with an owned market share of about 12.5 billion USD 11). Finally, the single sided PCBs market is estimated to be worth 11.05 billion USD 12). The market can also be classified according to PCBs is estimated to be the structure, and possibly specialisation of the PCB. The traditional rigid PCB market represents 36 billion USD, while the flexible PCB market represents about 13.5 billion USD and the HDI boards market is valued about 9 billion UDS. 13). PCBs are currently used mainly for consumer electronics and IT & telecommunication devices, being worth about 50% of the market share 14).
From this market analysis, the focus is put on the most common and massively produced PCB, which is the multilayer PCB, followed by double-sided PCBs, with a rigid structure. They are at the core of a large diversity of electronic components. Their manufacturing should be mainly localised in Pacific-Asia region.
Perimeter
Included in the study
This study aims at providing the cradle-to-gate environmental impact of the manufacturing of:
- Rigid bare PCBs.
- Standard PCB specialisation.
- With either 2 or more layers.
Excluded from the study
This study exludes:
- All electronics devices assembled on the bare PCB.
- R&D activities to develop the PCB.
- The transition of the boards between manufacturing stages, which can be either manual or automated.
- The input copper clad laminate process impact.
- The end-of-production line multiple tests.
Functional unit and reference flows
Functional unit
The functional unit of this study is “manufacture one rigid standard bare PCB”.
Reference flow
The reference flow is one square meter of manufactured PCB.
State of the art: environmental impacts
For all relevants academic works found, we extracted:
- Methodology (LCA/GHG, env. indicators, etc.)
- Types of technologies covered (system definition)
- Life cycle stages covered
- Flux included in the scope
- Main results (hot spots, orders of magnitude, etc.)
- Limitations
The following table displays the cross-paper comparison.
| Grant 2023 | Ozkan 2017 | Liu 2014 | Le Gargasson 2025 | Hischier 2007 and updates (Ecoinvent v3.12) | |
|---|---|---|---|---|---|
| Method | ReCiPe Endpoint | CML 2001 midpoint | CML 2001 midpoint | GWP only (Scope 1+2 / Ecoinvent EF v3.1) | EF v3.1 |
| Scope | Cradle-to-grave | Cradle-to-waste | Board fab + manufacturing | Gate-to-gate / Cradle-to-gate | Cradle-to-gate |
| Use phase | Excluded | Excluded | Excluded | Excluded | Excluded |
| Technology | FR-4, PET, paper, multilayer | FR-4 single-layer | FR-4 vs paper P-PCB | FR-4 PTH, all stackups | FR-4, 6Layers SMT |
| Key GWP hotspot | Epoxy resin, layer count | Etching (FAETP, ODP); copper in board fab | Copper (O-PCB); silver (P-PCB) | Electricity consumption (~86% of GHG) | Electricity (~45% GWP) |
| GWP order of magnitude | ~50–500 kg CO₂eq/m² | 18.6 kg CO₂e/m² | 39.2 kg CO₂e/m² (O-PCB) | 60–200 kg CO₂eq/m² (company range) | 200 kg CO2eq/m² |
- Liu et al. (2014) — Future Paper-Based Printed Circuit Boards for Green Electronics: Fabrication and LCA15)
Methodology This work employs an LCA approach following ISO 14040, using GaBi 6.0 with the CML 2001 (Apr. 2013) characterisation method — a midpoint approach. The impact categories considered are ADP (fossil), AP, EP, FAETP, GWP, HTP, ODP, POCP, and TETP. The Functional unit defined is “fabrication of 10,000 m² of four-layer PCB (paper or epoxy substrate)”.
Technologies covered The paper explores a novel paper-based PCB (P-PCB) technology, consisting of a screen-printed polyurethane-based electrically conductive adhesive (ECA) with micro-silver flakes on commercially available printing paper, assembled via both pressure-sensitive adhesive and drilled/filled vias. This technology is compared against a conventional four-layer organic PCB (O-PCB, FR-4) using data from Shenzhen manufacturers.
Life cycle stages This study concerns cradle-to-gate-plus-waste stages, meaning raw material extraction, fabrication, and waste disposal (recycling of silver and paper for P-PCB; incineration/waste treatment for O-PCB). Transportation and use phases are explicitly excluded.
Flows in scope The main flows at stake for the P-PCB are paper (~88 wt%), methyl acrylate adhesive (~6.6%), silver flakes (~2.8%), polyurethane binder (~2.8%), and electricity (0.173 kWh/m²). O-PCB ones are copper foil, glass fibre cloth, polymer resin, electroplating chemicals, and energy-intensive wet processes. In both cases, the impact tracking up to resource extraction is made using Ecoinvent.
Main results P-PCB environmental burdens are approximately two orders of magnitude lower than O-PCB across almost all categories (e.g. GWP ratio 71:1, HTP 224:1, AP 125:1). The dominant driver of O-PCB impacts is copper: its mining/refining contributes 84–90% of FAETP, HTP, and TETP. For P-PCB, paper (~88 wt%) drives most impact categories, while silver (only 2.83 wt%) accounts for >75% of HTP due to its highly polluting refining process. P-PCB cost is estimated at $15–30/m²$ vs $90–120/m²$ for O-PCB.
Limitations Transportation and use phase excluded, which may disadvantage or advantage either technology depending on application. P-PCB prototype only meets requirements for low-density, low-frequency electronics (inferior line spacing ~100 µm vs ~50 µm, poor flame retardation and moisture resistance). The LCA relies partly on modelled/assumed data for P-PCB inventory since no industrial-scale production exists. Silver production inventory was simplified.
- Ozkan, Elginoz & Germirli Babuna (2017/2018) — Life Cycle Assessment of a PCB Manufacturing Plant in Turkey 16)
Methodology The methodology followed is a streamlined LCA using Ecoinvent-integrated GaBi software. The characterisation is performed via CML 2001 (Guinée et al. 2002), a midpoint method. Eleven impact categories are considered: GWP, AP, EP, ODP, FAETP, MAETP, TETP, POCP, HTP, ADP fossil and ADP elements. The functional unit is “1 m² of ready-to-use PCB”. The results are optionally normalised to eco-points using the ReCiPe Endpoint (a damage-oriented endpoint method aggregating impacts into three areas of protection).
Technologies covered The subject of the study is a single-layer, single-sided FR-4 PCB intended for white goods (washing machines, refrigerators, etc.). It is produced in a Turkish facility with a capacity of 22,500 m²/month. The input copper clad laminate boards are imported, their manufacturing impact is thus estimated using data from literature. The PCB manufacturing process is modelled based on 6 months data collected on-site.
Life cycle stages The life cycle stages are the input copper clad laminate boards fabrication (from literature: Ord & di Corcia 2005) and the PCB manufacturing (on-site data). End-of-life and use phases are excluded. Transportation are also excluded and constitute one of the main stated limitation.
Flows in scope For board fabrication, the main inputs are: glass fibre (1.596 kg/m²), copper (0.615 kg/m²), epoxy resin (0.31 kg/m²), and water (0.407 m³/m²). The PCB manufacturing main inputs are water, solvents, HCl-based etching agent (1.89 kg/m²), NaOH, solder mask, solder bar, flux, and energy (7.135 kWh/m²). Outputs are wastewater (0.465 m³), recovered copper, solder slag, and air emissions (TOC, dust, Ag, Cu traces). Wetting oil and VOC emissions are excluded, as there is no database data available.
Main results Board fabrication impacts dominates most categories (HTP, EP, TETP, AP, GWP, POCP, ADP). PCB manufacturing dominates FAETP (89%) and ODP (73%). Etching is the key hotspot: copper-containing wastewater sludge sent to incineration causes 81–91% of FAETP; HCl usage drives 90% of ODP contribution from manufacturing. Copper in board fabrication is the single largest material contributor across AP, HTP, TETP. Lead-free Sn-Ag solder causes ~10% more GWP than conventional Sn-Pb due to high Sn content.
Limitations Tha main limitations are the transportation which is fully excluded (acknowledged as main limitation) and the excluded use and end-of-life phase excluded. VOC emissions and wetting oil are not modelled (absent from databases). The choice of single-layer board is not representative of multilayer products. The focus on a country-specific Turkish data is valuable but not generalisable to other geographies without adaptation of energy mix.
- Grant, Zhang & Kettle (2023) — Improving the Sustainability of Printed Circuit Boards Through Additive Printing17)
Methodology The impacts are assessed follwing a LCA using the GaBi (Sphera) software with the EcoInvent database. The scoring is performed via the ReCiPe Endpoint. Impact categories include GWP (100 years), acidification potential, human toxicity cancer total, ozone layer depletion, particulate matter, metal depletion, and water depletion. The functional unit is “25 cm² of a single-layer PCB”.
Technologies covered The study focuses on standard FR-4 PCB (subtractive etching, HASL finish) as baseline. A comparison is performed against PET-substrate PCBs and paper/corrugated board PCBs with printed silver ink as the conductive layer. Multilayer configurations (1 to 16 layers) are also analysed.
Life cycle stages The stages covered ranges from cradle to grave, i.e, it includes raw material extraction, manufacturing (full process chain), and end-of-life (landfill and incineration). The use stage is explicitly excluded.
Flows in scope The materials involved are epoxy resin, copper foil, glass fibre, solder paste, etching chemicals, solder mask and protective coatings). The energy flows at stake occur during manufacturing, waste streams, landfill/incineration emissions. Transportation is constrained to Great Britain (GB), which implies the GB electricity mix is applied.
Main results Manufacturing dominates over end-of-life across all impact categories. Within manufacturing, epoxy resin is the largest GWP contributor (due to its mass dominance), followed by copper and glass fibre. GWP scales linearly with layer count (y = 0.6158n + 1.2472 kg CO₂eq per 25 cm²). Switching substrate from FR-4 to corrugated board yields the largest environmental reduction; PET is an intermediate improvement but raises human toxicity significantly. Replacing copper with printed silver ink on a paper substrate reduces GWP from 2.87 to 2.83 kg CO₂eq — marginal but directionally positive.
Limitations The use stage is entirely omitted. The system boundaries are restricted to GB, thus limiting the geographic generalisability. Functional unit is small, which may not represent industrial-scale multilayer boards well. Paper and PET substrates technology still are at low technology readiness, and thus cannot constitute a near-future alternative. The soldering constraints (low-melting-point solders required) are noted but not fully modelled.
- Le Gargasson et al. (2025) — PCBnCO: A Carbon Intensity Model of FR-4 PCBs Based on Company Data 18)
Methodology This paper adopts two complementary approaches: (1) a top-down analysis of annual sustainability reports from 11 of the world's 25 largest PCB manufacturers (2020–2023), extracting gate-to-gate GHG emissions (Scope 1 + Scope 2) and normalising the data to kg CO₂e/m²; (2) a bottom-up cradle-to-gate affine model as a function of layer count, anchored on two LCA entries, the Ecoinvent v3.10 EF v3.1 6-layer entry, and the Dynamic Electronics 10-layer assessment. The emissions of manufacturer located in Tailand, Taiwan, and China, are renormalized to the global location using Ecoinvent v3.10 electricity mixes.
Technologies covered The technologies studied are the Plated Through-Hole (PTH) FR-4 PCBs only, which are the dominant type (~68% of global production per Prismark 2021). HDI boards, containing blind, buried and micro vias are explicitly excluded.
Life cycle stages The stages covered by the first top-down models are gate-to-gate, accounting for factory operations only for scope 1 and 2. The second model 2, the bottom-up one, covers cradle-to-gate, i.e., from ore extraction to factory gate. The end-of-life is explicitly excluded from both models as waste management is estimated at <2% of the carbon intensity in prior literature.
Flows in scope The study of company reports accounts for aggregated GHG flows, both direct ones (Scope 1) and purchased ones (Scope 2). 86% of these emissions are attributed to electricity. The affine model inherits Ecoinvent and Dynamic Electronics inventories, which include materials (copper, epoxy/prepreg, fibre) and energy per manufacturing step. Detailed chemical flows are not individually inventoried in this paper.
Main results Large variance in declared carbon intensities: it ranges from 27 to 383 kg CO₂e/m² across companies (factor of ~14). Average gate-to-gate intensity of 11 of the 25th top PCB manufacturer is 139.15 kg CO₂e/m². It is normalised to 109.03 kg CO₂e/m² when using Global electricity mix instead, which is recommended when the electricity mix is unknown. 153.51 kg CO2e/m² can be selected for pessimistic evaluation while 60.73 kg CO2e/m2 is for optimistic estimations. The affine cradle-to-gate model provides the carbon intensity $y$ at a global location per surface unit from the equation $y = 7.81n + 57.97$ kg CO₂e/m², where $n$ = number of layers. When switching to another electricity mix, the French one for instance, the intensity drops to just 6.27–15.85 kg CO₂e/m² (factor ~10 below global average), reflecting the importance of energy mix in carbon intensity. From the built affine function, one can note that PCB area for a given number of layers is an actionable design lever for eco-design.
Limitations Only carbon intensity is assessed — no other environmental indicators. The company reports are heterogeneous, not audited, and often lack stackup-specific data; some boundary adjustments between years create discontinuities. The affine model rests on only two anchor points (6-layer Ecoinvent entry and one manufacturer's 10-layer self-declaration). Gate-to-gate scope of annual reports is narrower than cradle-to-gate of the model, complicating direct comparison. Manufacturing secrets limit detailed inventory verification
- Hischier et al. (2007) — Ecoinvent Report No. 18, Part II: Life Cycle Inventories of Electric and Electronic Equipment — Printed Wiring Boards
Methodology This is not an LCA study producing impact results directly, but rather a Life Cycle Inventory (LCI) dataset construction report, feeding the Ecoinvent database (v2.0). The functional unit is 1 m² of unmounted PWB. Impact assessment results are computed downstream by LCA practitioners using characterisation methods of their choice applied to the inventory.
Technologies covered Two rigid FR-4 PWB types are inventoried, representative of ICT applications: * A 6-layer multilayer PWB for surface mount technology (SMT), typical of computer mainboards, graphics cards, etc. * A 2-layer double-sided PWB for through-hole technology (THT), typical of power supply units or simpler industrial electronics.
For each type, three datasets are constructed: Pb-containing surface finish (HAL Sn-Pb), Pb-free surface finish (mixture of HAL-Sn, immersion tin, immersion silver, and ENIG for SMT; HAL-Sn and immersion silver for THT). Flexible, metal-core, HDI, and specialty PWBs are excluded.
Life cycle stages covered Cradle-to-gate manufacturing : from raw material inputs at the factory gate to the finished unmounted PWB ready for component mounting. Upstream raw material extraction is covered through background Ecoinvent datasets (e.g. copper mining, glass fibre production). Component mounting, use phase, end-of-life, and recycling are explicitly excluded from these datasets (treated in other parts of the Ecoinvent report No. 18).
Flows included in scope The inventory is notably comprehensive at the elementary flow level: Inputs: cores and prepreg (modelled as glass-fibre reinforced polyester), copper foil and copper balls for electroplating, process chemicals (HCl, NaOH, H₂O₂, H₂SO₄, FeCl₃, NaCl, resists, solvents, potassium carbonate, sodium persulfate, ammonium chloride), surface finish metals (Sn, Pb, Ag, Au, Ni depending on variant), solder mask (phenolic resin proxy), electricity (UCTE mix), natural gas and light fuel oil for heat, ultrapure water and process water, transport of inputs (standard distances by lorry and rail), and production plant infrastructure. Outputs/emissions to air: NMVOC (from resist), acid/base aerosols (HCl, NaOH, H₂O₂, H₂SO₄), Cu and Pb particulates (from electroplating, drilling, HAL), PM2.5 and PM2.5–10, waste heat (100% of electricity input). Emissions to water: heavy metals (As, Cd, Cr, Cu, Hg, Ni, Pb, Zn) discharged via on-site wastewater treatment plant to river, AOX, COD, BOD, fluoride. Waste: hazardous waste to incineration, galvanisation sludge to residual material landfill, WWTP sludge, municipal waste to incineration, solvents/resins/paints to hazardous waste incineration. Recycled fractions (copper chloride, paper/plastic scraps, biogenic waste) are excluded per Ecoinvent methodology.
Main results No direct impact results are published in the report itself, but from the inventory structure and the PEF 3.1 calculations:
For reference, applying PEF 3.1 in SimaPro to the “printed wiring board production, for surface mounting, Pb free” https://ecoquery.ecoinvent.org/3.12/cutoff/dataset/9764/documentation dataset yields approximately 200 kg CO₂eq/m² for GWP, with electricity consumption as the dominant contributor (~45%). For abiotic depletion of elements (ADP-e), the value is approximately 0.032 kg Sb-eq/m², driven by copper (~60%) and gold in the surface finish (~30%).
Limitations The dataset carries several significant limitations, most of which compound over time: Temporal and technological representativeness: Primary data sourced from AT&S AG (2006), US EPA (1995/2000), and ZVEI (2006). Given the pace of process optimisation in PCB manufacturing — particularly energy efficiency and chemical management — this nearly 20-year-old data is likely to overestimate current consumption intensities. This is explicitly flagged as a concern. Electricity mix: The dataset uses the Global electricity mix. Users can adapt the electricity mix by copying and editing the dataset in SimaPro or similar tools, but this requires awareness and additional effort. Gold and surface finish: As the amount of gold in the PCB is a key contributor to environmental impact, there is a need for precise gold quantity in PCB for an accurate LCA. Also, for PCBs without a gold finish there is an important “hidden burden” by using this dataset, though it is possible to copy the dataset and subtract the gold if needed .
Other information on impact assesment :
Another known hotspot in the manufacturing process is the etching steps 19). This manufacturing step requires numerous successive operations, thus having a high energy footprint. It consumes a high quantity of chemical elements, that are present in the resulting waste water. It contributes to almost all the impact for the Fresh Aquatic Ecotoxicity Potential, Ozone Depletion Potential, and Fresh Aquatic Ecotoxicity Potential indicators. The main contributors to these impacts are the incineration of copper and the chloride acid consumption.
Potential parameters affecting environmental impacts:
Impactful parameters :
- Technology: Through-Hole Technology (THT) or Surface Mount Technology (SMT)
- Substrate material: FR4 (mostly used), bio-based material, etc.
- Number of layers (1 to 16 generally)
- Surface (m2) → yield
- Type of surface finish
By proposing a parametric LCA, like choosing between finish types and electricity mixes, we should allow easier and better assesment of the PCB.
Life cycle Inventory (⚠️WORK IN PROGRESS⚠️)
Raw materials
Material composition
A PCB is composed of a succession of copper, substrate, and pre-preg layers. 20)
The type of substrate material varies depending on the target application of the PCB. The main substrate materials are 21), 22), 23):
- FR-4: It is the most common PCB subtrate material. It is composed of epoxy resin reinforced by glass fibers. It has the property to be resistant to fire, water and moisture. The main elements in the glass fibers are silicon dioxide, calcium oxide, aluminum oxide, boron oxide, sodium/potassium oxide, magnesium oxide, iron oxide, titanium oxide, and fluoride, appearing in a decreasing order of concentration24). The epoxy resin contains an epoxide group, made of two carbon and one oxygen atoms. The most common epoxy material is the DGEBA one, containing carbon hydrogen, chloride and oxygen25). Some derivatives exist, including one resistant for high temperature, using glass with higher fusion temperature 26). The abreviation FR stands for Flame Retardant.
- FR-2: a cheap version of a Flame Retardant material, composed of a specific type of impregnated paper on top of glass fiber, called phenolic material. It features poor performances and is thus used mainly for single-sided PCBs 27).
- CEM-1: This material is composed of a paper core, surrounded by woven glass epoxy. It is cheaper than FR-4, but limited to single-sided PCBs 28).
- CEM-3: It has a similar composition as CEM-1, with a non-woven glass mat core instead of a paper one. It is more resistant and performant than CEM-1, cheaper but still less performant than FR-4. It is a cheaper alternative for double-sided PCBs 29).
- Metal substrate: aluminum is often used as metal substrate, sometimes it is copper. It has the advantage to dissipate heat efficiently. It is mostly used for single or double-sided PCBs30).
- Polytetrafluoroethylene (PTFE): this substrate is made of a plastic with very low resistance, which is adapted for high-frequency applications. The chemical composition is mainly based on carbon and fluorine atoms. It is also very light and flame resistant 31). It has also a proprietary alternative called Rogers®.
- Ceramics: this substrate is employed for application requiring high temperature resistance, high thermal conductivity and need for high reliability. It is more expensive and fragile than a FR-4 substrate. It is often made of alumina, aluminum nitride or silicon carbide. 32).
The pre-preg material is composed of fiberglass or glass fabric reinforced by epoxy resin. The differences between pre-preg is mainly the content of resin, which can be high, low or standard, and influence the board thickness, its structure and impedance, as its role is to isolate PCB layers one from each other.
Once the PCB layers are laminated and the copper traces printed, the metal needs to be protected by an additional layer of material. This layer can be composed of:
- Electroless Nickel Immersion Gold (ENIG)33): it consists in a film of nickel deposited on top of copper pads using electroless plating technique. The nickel is then protected from corrosion and oxidation by a thin layer of gold using immersion methods.
- Electroless Nickel Electroless Palladium Immersion Gold (ENEPIG) 34): similar to ENIG finish, with a thiner nickel layer and an additional layer of palladium deposited via electroless plating. It has the advantage to be compatible with almost any kind of PCB.
- Hot Air Solder Leveling (HASL)35): this technique is very affordable and offers a high solderability. It is not compatible with very thin-pitched PCBs. This finish layer is composed of a mixture of eutectic tin and lead. Its application is performed in three steps: the board is immersed in a bath of molten solder. The extra thickness of solder is removed thanks to hot air knives, that are heated above the solder melting temperature. Finally, the board is cleaned to remove all residues remaining after solder soliditication.
- Organic Soderability Preservative (OSP)36), 37) is affordable and features a very thin and flat finish. However, it doesn't resist to long storage. It is adapted for fine-pitch design, consumer electronics, and nickel-sensitive applications. It is composed of azole-based organic compounds like benzotriazoles, imidazoles or benzimidazoles. It is applied by immersing the board into the organic solution, that will form a thin film in interaction with copper atoms.
- Immersion silver38). This finish type has the advantage of providing a flat protection and requiring only one additional layer. However, it is sensitive to tarnishing, thus it requires cautious manipulation.
- Immersion tin39): a film of tin is deposited on copper pads using immersion technique. It is the cheapest finish type among all immersion-based technique.
Manufacturing
This section is dedicated to list the technical information needed to obtain the LCI.
The manufacturing process for multilayer PCBs is highly complex and is explained in more detail on this page: Manufacturing processes of multilayer PCBs.
To summarise:
- the circuits on each layer are manufactured in what are known as inner layers. Each of these layers undergoes the following manufacturing steps: pre-treatment, lamination of the photosensitive film, exposure, development, etching, stripping.
- These inner layers are then stacked, with insulating layers interposed between them, and this stack is laminated.
- Holes are drilled into this laminated sheet, enabling, amongst other things, all the inner layers to be electrically connected.
- Copper is deposited within these holes, enabling electrical connections between all the layers
- The circuit on the outer layer of the PCB is then manufactured using a complex process
- An insulating material called a solder mask is applied to cover the entire outer surface of the PCB. Its role is to protect the outer layer’s circuit. However, certain parts of this outer layer are left free of solder mask, notably to allow the electrical connection of components that will be added later.
- The final step is the surface finish: this step protects the exposed parts of the outer circuit.
Throughout the manufacturing process, tests are carried out to ensure that each stage is proceeding correctly.
Several PCBs are manufactured simultaneously on a single panel. They are separated at the end of the process during the profiling stage.
Next steps
What do we know we don't know?
TBC
What are the identified challenges?
TBC
What paths/ideas should be explored?
TBC